Configuration
Blender Probe requires the Blender runtime to function; therefore, you must configure the runtime settings before using any of its features.
OptionA: Automatic via blup 🦀
If you manage your Blender versions with blup, no additional configuration is required. The plugin automatically detects the correct Blender executable based on your project’s .blender-version file or the global default.
(This makes it easy to frequently switch the target Blender version for testing, or to track API changes by diffing generated type stubs across versions. The same applies to daily builds, enabling early response to upcoming changes.)
OptionB: Manual Path Configuration
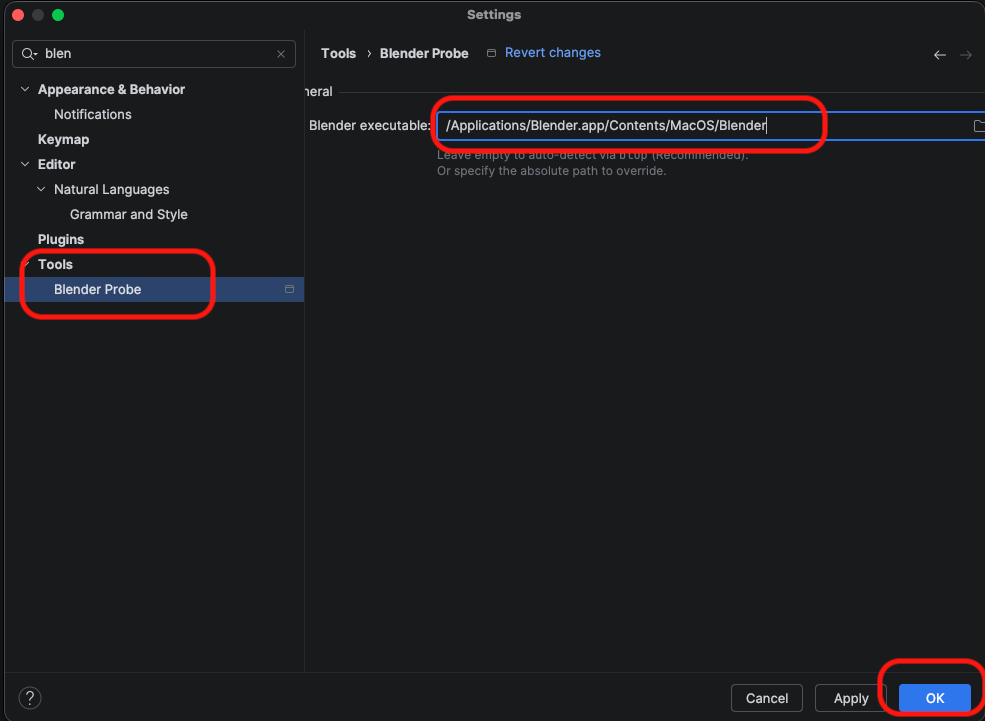
If you don’t use blup, you must configure the path to your Blender executable before using the plugin.
- Go to Settings/Preferences > Tools > Blender Probe.
- Set the Blender Executable Path:
- Windows:
C:\Program Files\Blender Foundation\Blender 5.0\blender.exe - macOS:
/Applications/Blender.app/Contents/MacOS/Blender - Linux:
/usr/bin/blender
- Windows:
- Click OK.
Creating a New Addon Project
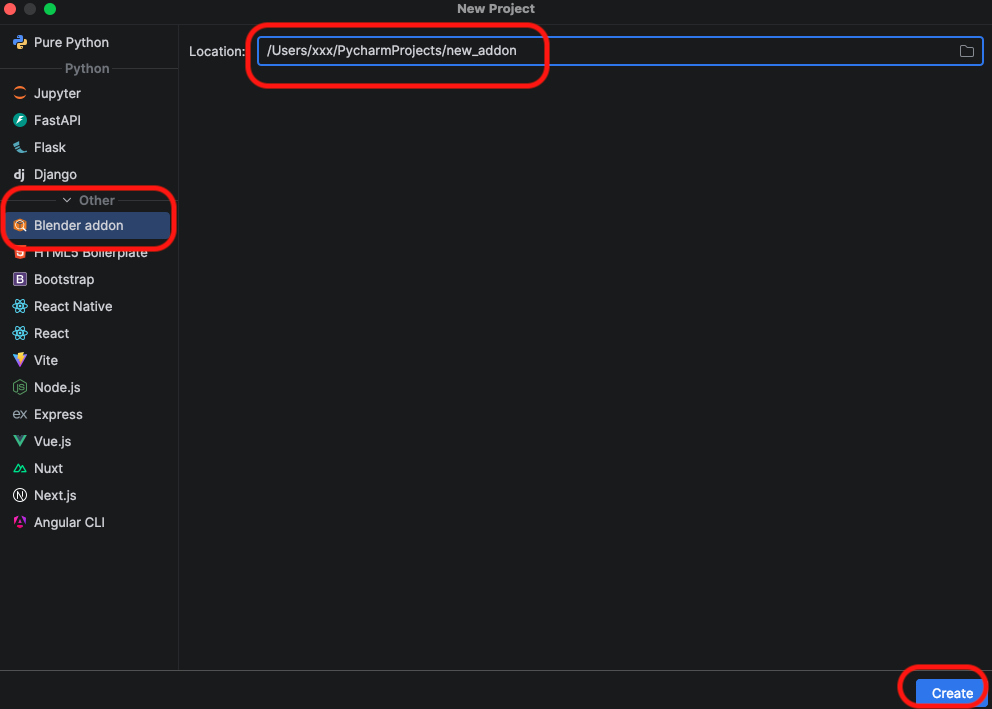
You can start development with a simple addon, along with a structure that includes tests and CI already set up.
- Go to File > New Project
- Select Blender addon from the generator list on the left.
- Configure your project location and click Create.
This generates a clean project structure compliant with Blender 4.2+ Extensions:
my_addon_package/: The addon’s Python package. A package with the name you entered in the wizard will be created.tests/: A ready-to-run test suite..github/: CI workflows for GitHub Actions.LICENSE: A GPLv3 license file.pyproject.toml: Python tooling configuration.
Generating Code Stubs (Autocompletion)
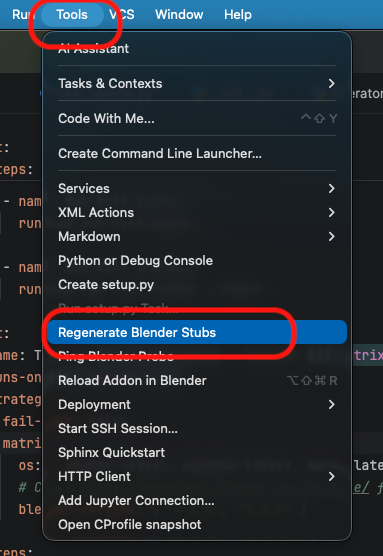
To enable code completion for bpy and other Blender modules:
- Open your project in PyCharm.
- Go to Tools > Regenerate Blender Stubs.
- Wait for the progress bar to finish. A hidden folder
.blender_stubswill be created in your project root and automatically marked as a Source Root.
💡 Tip: The
.blender_stubsfolder contains generated files that do not need to be version controlled. It is recommended to add.blender_stubs/to your project’s.gitignorefile. (If you created your project using the Blender Addon wizard, this is already configured.)
💡 Tip: Since Blender’s API is highly dynamic, PyCharm sometimes cannot infer types automatically. To get full autocompletion, use Type Hinting:
def my_func(context: bpy.types.Context):
    obj: bpy.types.Object = context.active_object
    print(obj.location) # Autocompletion works
💡 Tip: If the generated stubs don’t meet your needs, you can delete
.blender_stubsand use static stubs likefake-bpy-module. 💡 Tip: In teams that require reproducible type checking (mypy/pyright/pyrefly/ty) across environments or Blender versions, committing.blender_stubscan be a valid exception. If you do, configure.gitattributesaccordingly.
Running & Debugging Your Addon
You can launch Blender with your addon loaded, or use the debugger.
Setup
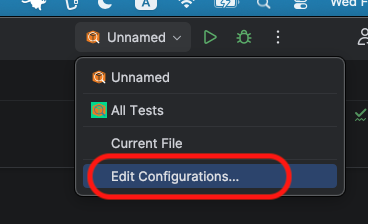
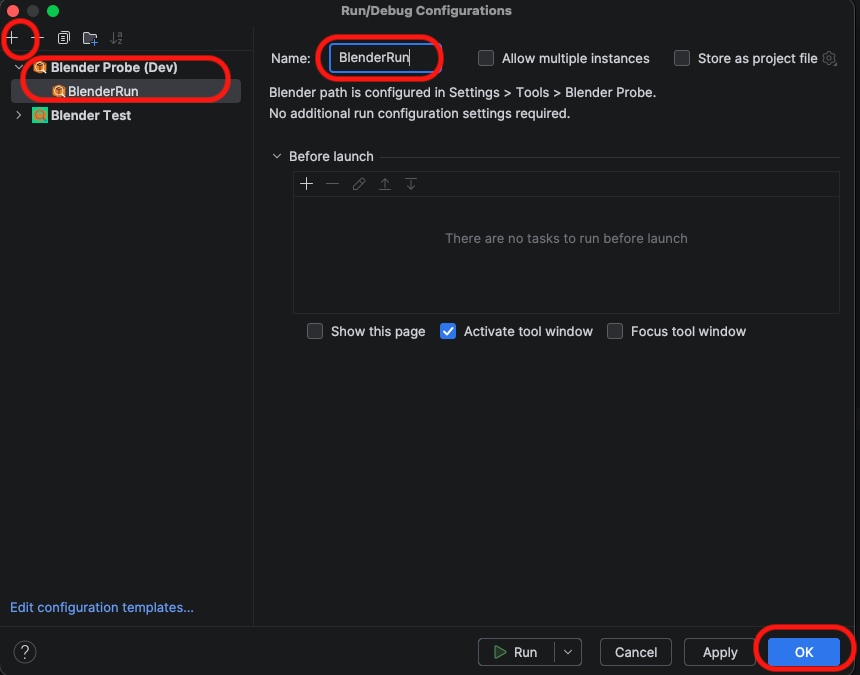
- Open Run/Debug Configurations (Top right dropdown > Edit Configurations).
- Click the + button and select Blender.
- Name: Give it a name (e.g., “BlenderRun”).
- Click OK.
Run or Debug
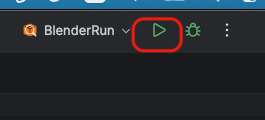
Run
- Just Click the Run button. (The plugin auto-detects your addon root by the
blender_manifest.toml.)
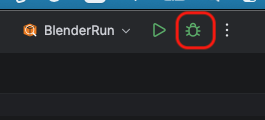
Debug
- Set a breakpoint in your Python code (click the gutter next to a line number).
- Click the Debug (Bug icon) button.
- Blender will launch, and PyCharm will automatically attach. When a breakpoint is reached, execution will pause.
- Force Viewport Redraw: While paused at a breakpoint, you can force Blender to redraw its UI/Viewport to see the current state. (⚠️ Note: This can be a heavy operation depending on your scene. Avoid rapid repeated presses.)
- Windows / Linux:
Ctrl + Alt + Shift + D - macOS:
Cmd + Opt + Shift + D
- Windows / Linux:
Hot Reloading
You can use Hot Reload to apply changes instantly, making it quick to verify code changes for UI panels, operators, and more.
- Ensure Blender is running, launched via the Run or Debug configuration from PyCharm.
- Make changes to your Python code.
- The reload is triggered by one of the following methods:
- Automatically: Simply switch focus from PyCharm back to Blender. (Requires Save files when switching to a different application enabled in System Settings > Autosave).
- Manually: If the above setting is disabled, the reload is triggered by manually saving the file (e.g., Ctrl/Cmd + S).
- Check the Blender console or PyCharm notification for confirmation. Your addon is now running the updated code.
Note: This performs a “Deep Reload” by unregistering the addon, purging relevant modules from
sys.modules, and re-registering. This handles most code changes, but complex state changes may still require a restart.
Tests
🚀 Fast Track: If you used the Project Wizard, fully configured test files (
tests/run_tests.pyandtests/test_sample.py) are already included.💡 Tip: Setting up tests that run on a real Blender instance while integrating natively with PyCharm (TeamCity) and ensuring the exact same configuration runs in CI is inherently complex. To set up tests in an existing project, the quickest way is to generate the test files using the Project Wizard in a temporary project and then copy-paste them into your own.
PyCharm native unit testing
You can use PyCharm unittest.
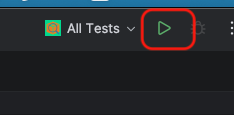
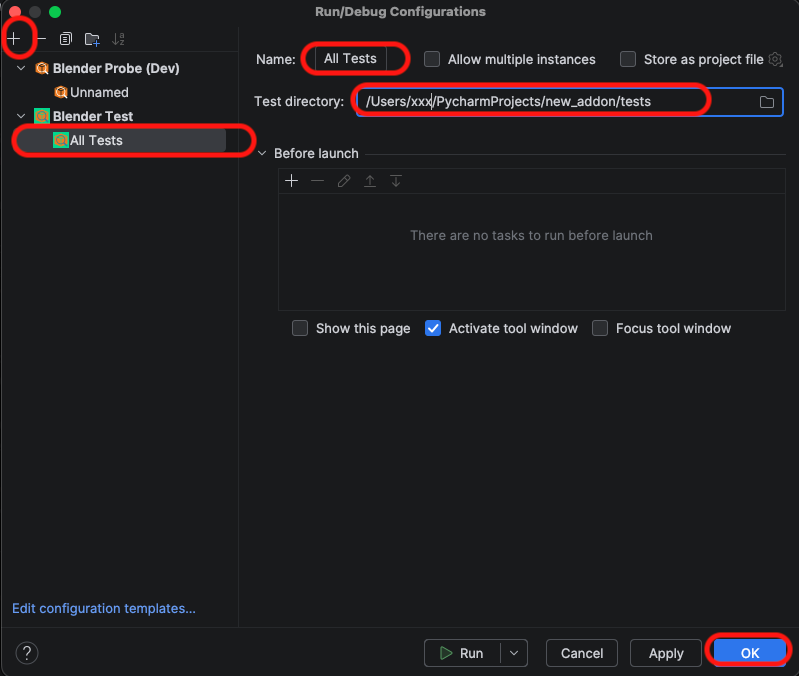
- Open Run/Debug Configurations.
- Click the + button and select Blender Test.
- Name: Give it a name (e.g., “All Tests”).
- Test Directory: Select the folder containing your test scripts.
- Create a
run_tests.pyfile like this template in your test folder. - Click the Run button.
Writing Tests
Once configured, you can implement tests as below and begin practicing TDD.
# test_sample.py
import unittest
import bpy
# from my_addon_package import operators  <-- Works automatically!

class TestSampleOperator(unittest.TestCase):
    """
    Integration tests for a custom operator.
    Runs inside Blender via Blender Probe.
    """

    def setUp(self):
        # 1. Reset Blender to a clean state
        bpy.ops.wm.read_homefile(use_empty=True)

        # 2. Setup a test scene (Create a Cube)
        bpy.ops.mesh.primitive_cube_add()
        self.test_obj = bpy.context.object
        self.test_obj.name = "TestCube"

    def test_operator_logic(self):
        """Verify that the operator renames the object and adds a property"""

        # [Arrange]
        # Ensure initial state
        self.assertEqual(self.test_obj.name, "TestCube")
        self.assertNotIn("is_processed", self.test_obj)

        # [Act]
        # Execute your custom operator (e.g., defined in your addon)
        # Context is automatically handled by Blender.
        result = bpy.ops.object.sample_operator()

        # [Assert]
        # 1. Check return value
        self.assertIn("FINISHED", result)

        # 2. Check side effects (Logic verification)
        self.assertEqual(self.test_obj.name, "TestCube_processed")
        self.assertTrue(self.test_obj.get("is_processed"))


if __name__ == "__main__":
    unittest.main()
CI
Projects created with the Blender addon wizard come with a pre-configured GitHub Actions workflow (.github/workflows/ci.yml).
- No Config: Just push your code to GitHub.
- Automatic Testing: The workflow automatically installs a headless version of Blender (Linux) and runs your tests using the same runner logic as the IDE.
- Linting: Ruff checks your code style.
- Dependabot: Keeps your actions and dependencies up to date.