Running & Debugging Your Addon
You can launch Blender with your addon loaded, or use the debugger.
Setup
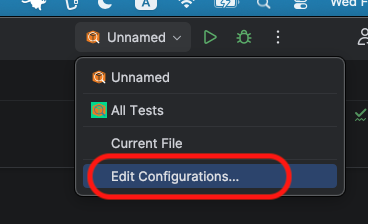
- Open Run/Debug Configurations (Top right dropdown > Edit Configurations).
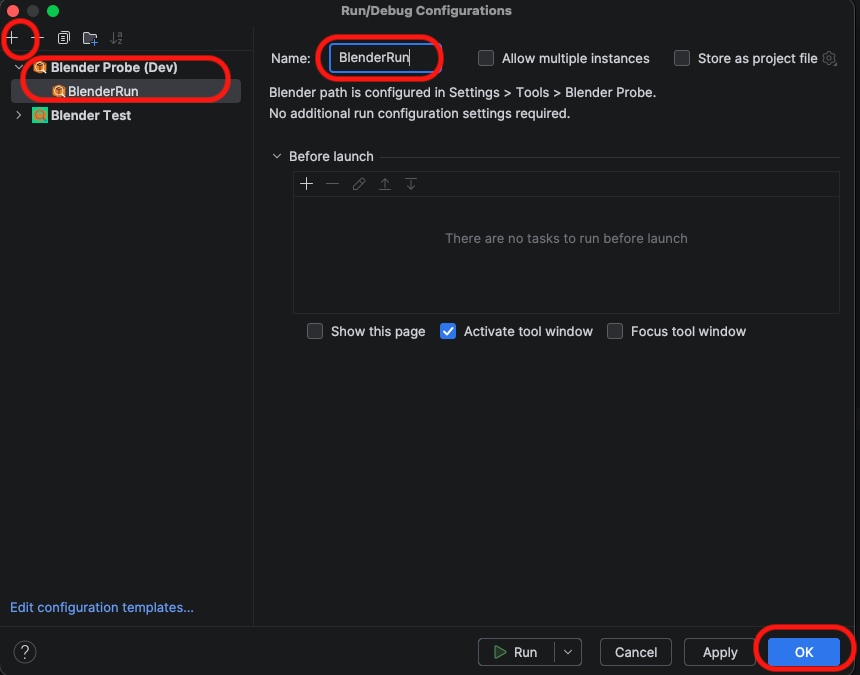
- Click the + button and select Blender.
- Name: Give it a name (e.g., “BlenderRun”).
- Click OK.
Run or Debug
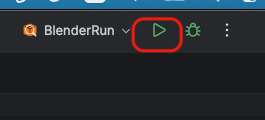
Run
- Just Click the Run button. (The plugin auto-detects your addon root by the
blender_manifest.toml.)
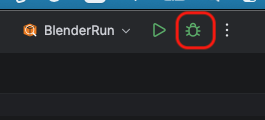
Debug
- Set a breakpoint in your Python code (click the gutter next to a line number).
- Click the Debug (Bug icon) button.
- Blender will launch, and PyCharm will automatically attach. When a breakpoint is reached, execution will pause.
- Force Viewport Redraw: While paused at a breakpoint, you can force Blender to redraw its UI/Viewport to see the current state. (⚠️ Note: This can be a heavy operation depending on your scene. Avoid rapid repeated presses.)
- Windows / Linux:
Ctrl + Alt + Shift + D - macOS:
Cmd + Opt + Shift + D
- Windows / Linux:
Hot Reloading
You can use Hot Reload to apply changes instantly, making it quick to verify code changes for UI panels, operators, and more.
- Ensure Blender is running, launched via the Run or Debug configuration from PyCharm.
- Make changes to your Python code.
- The reload is triggered by one of the following methods:
- Automatically: Simply switch focus from PyCharm back to Blender. (Requires Save files when switching to a different application enabled in System Settings > Autosave).
- Manually: If the above setting is disabled, the reload is triggered by manually saving the file (e.g., Ctrl/Cmd + S).
- Check the Blender console or PyCharm notification for confirmation. Your addon is now running the updated code.
Note: This performs a “Deep Reload” by unregistering the addon, purging relevant modules from
sys.modules, and re-registering. This handles most code changes, but complex state changes may still require a restart.